pgsc_calc Outputs & Report
This page provides detailed technical documentation for all outputs
produced by the PGS Catalog Calculator (pgsc_calc). It describes the
structure and content of each file generated by the pipeline.
For further guidance on how to interpret the results, including understanding variant matching statistics, ancestry adjustments, score distributions, and uncertainty in PGS estimation, please refer to the companion interpretation guide.
Overview
The PGS Catalog Calculator (pgsc_calc) generates a structured set of
outputs designed to make PGS analyses transparent, reproducible, and
interpretable. All output files are written to a results directory
(--outdir, default ./results/) with the following structure:
results
├── genotypes.zarr.zip
├── pipeline_info
├── report.html
├── scores.txt.gz
├── summary.csv
└── variant_match_logs.zip
- genotypes.zarr.zip contains cached genotypes which can be reused to speed up future runs
- pipeline_info contains nextflow pipeline execution data
- report.html contains a high level summary of the polygenic score calculation, including metrics and log summaries
- scores.txt.gz contains individual level calculated scores
- summary.csv contains a high level overview of how well the variants in the scoring files match variants in the target genomes
- variant_match_logs.zip contains a per-variant view of the matching procedure outcome
Each component contributes to the overall reproducibility and interpretability of the analysis.
Report
A summary report is also provided for your samples
(report.html). The report should open in a web browser and contains
useful information about the PGS that were applied, how well the
variants in your target dataset match with the reference panel and
scoring files, a summary of the computed genetic ancestry data, and
some simple graphs displaying the distribution of scores in your
dataset(s) as a density plot. Some of the sections are only displayed
with --run_ancestry, but we show them all here for reference.
The HTML report is designed to give a quick overview of data quality and interpretability:
- Variant matching tables help assess whether a PGS is suitable for your dataset. Low overlap suggests limited reliability.
- Ancestry plots show target samples in reference PCA space. Large outliers may reflect misclassified samples or genotyping/imputation issues.
- PGS distribution plots display population-level variation and can reveal technical artefacts or calibration issues.
Use these visual summaries to verify score validity before using results in downstream analyses.
--run_ancestry is not yet available for v3 alpha releases. Please use v2 to enable genetic ancestry similarity analysis and adjustment.
Section 1 (Metadata)
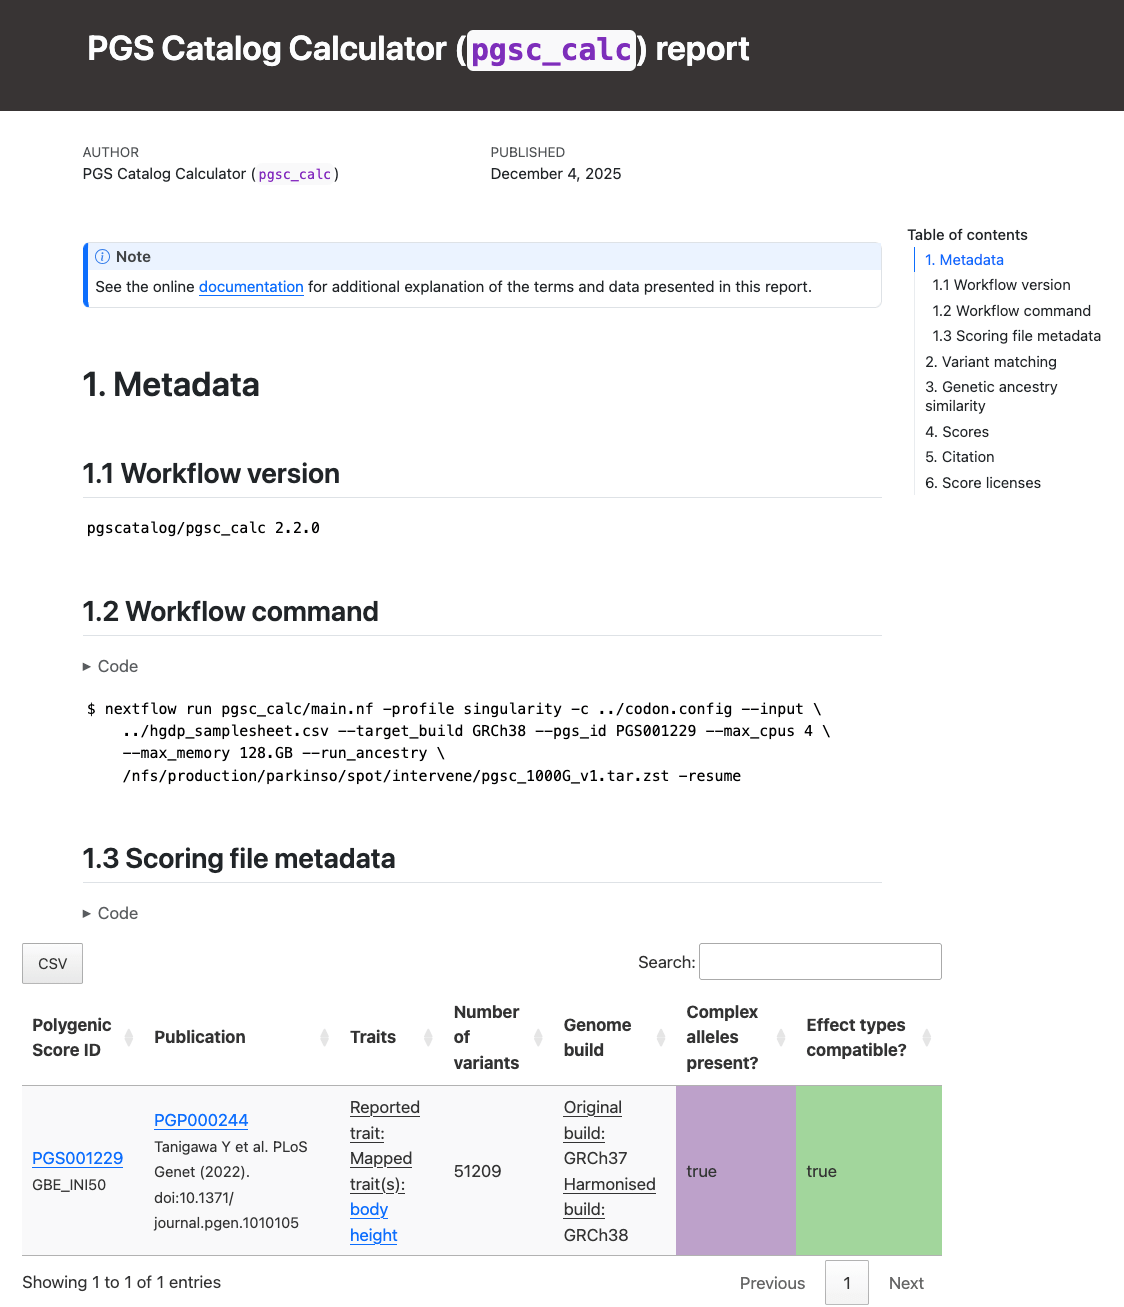
Section 1 (Metadata) of the report reproduces the nextflow command, and scoring file metadata (imported from the PGS Catalog for each PGS ID) describing the scoring files that were applied to your sampleset(s):
Section 2 (Variant matching)
Section 2 (Variant matching) reports how the variants in the target
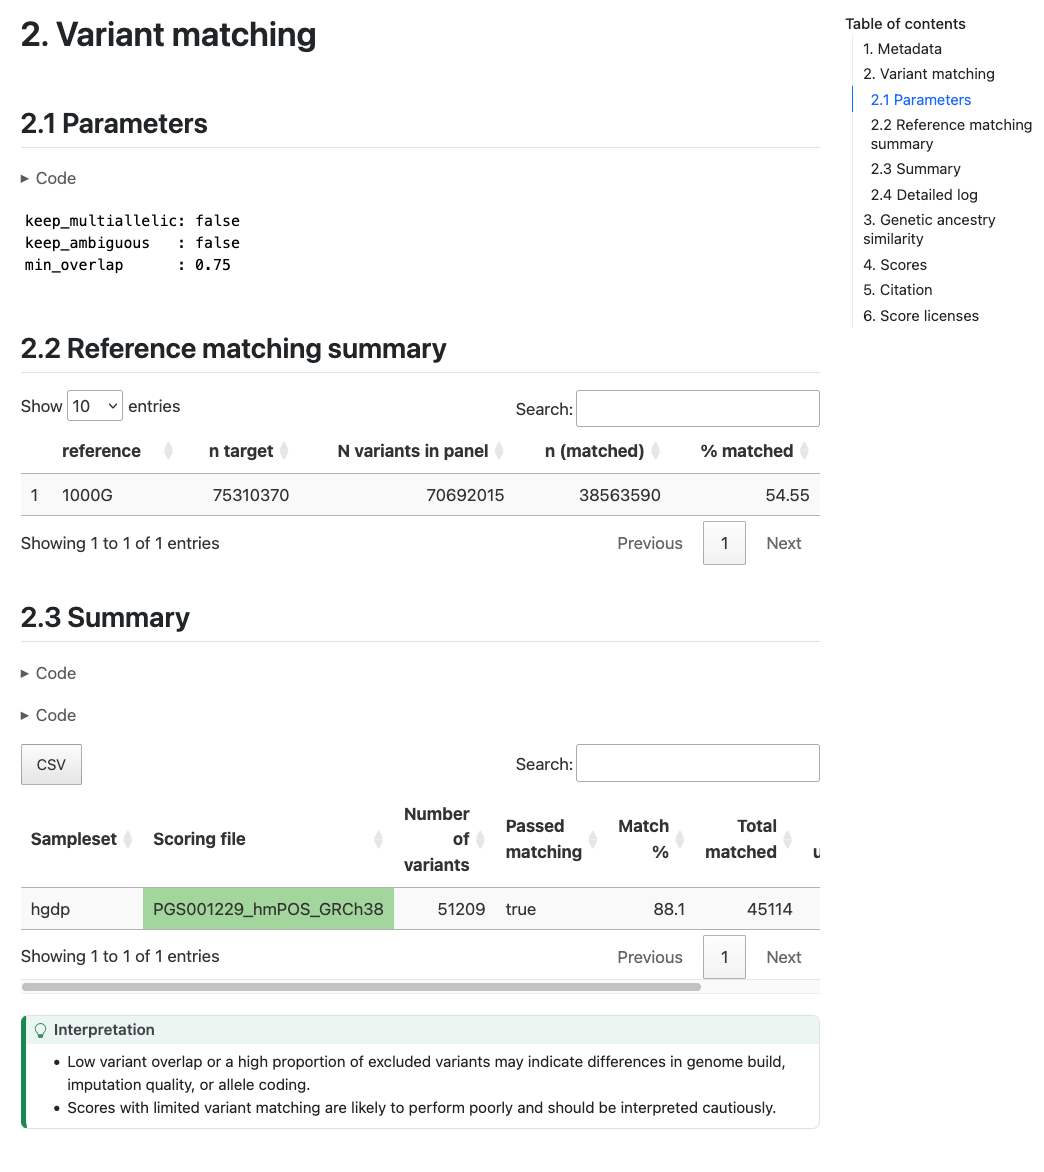
sampleset match the variants in the scoring files. The table in Section 2.2 ("Reference matching summary") describes the number of variants in the target dataset that overlap with the reference panel (only present with --run_ancestry). The table in section 2.3 ("Summary") provides a summary of the number and percentage of variants within each score that have been matched, and whether that score passed the --min_overlap threshold (Passed Matching column) for
calculation. The table in Section 2.4 ("Detailed log") provides a more detailed log of variant matches broken down by types of variants (e.g., strand ambiguous,
multiallelic, duplicates) for the matched, excluded, and unmatched
variants (see match/ section for details):
Section 3 (Genetic Ancestry)
Section 3 (Genetic Ancestry/Similarity) is intentionally empty. This analysis is not yet available in version 3.
Section 4 (Scores)
Section 4 (Scores) describes the number of scores that were calculated successfully. In Section 4.1.1 ("Density plot(s)") a visual display of the PGS distribution for a set of example score(s) (up to 6) is provided in the Density plot panel which can be helpful for looking at the distributions of the scores in the target and reference dataset and how it changes for difference PGS adjustment methods:
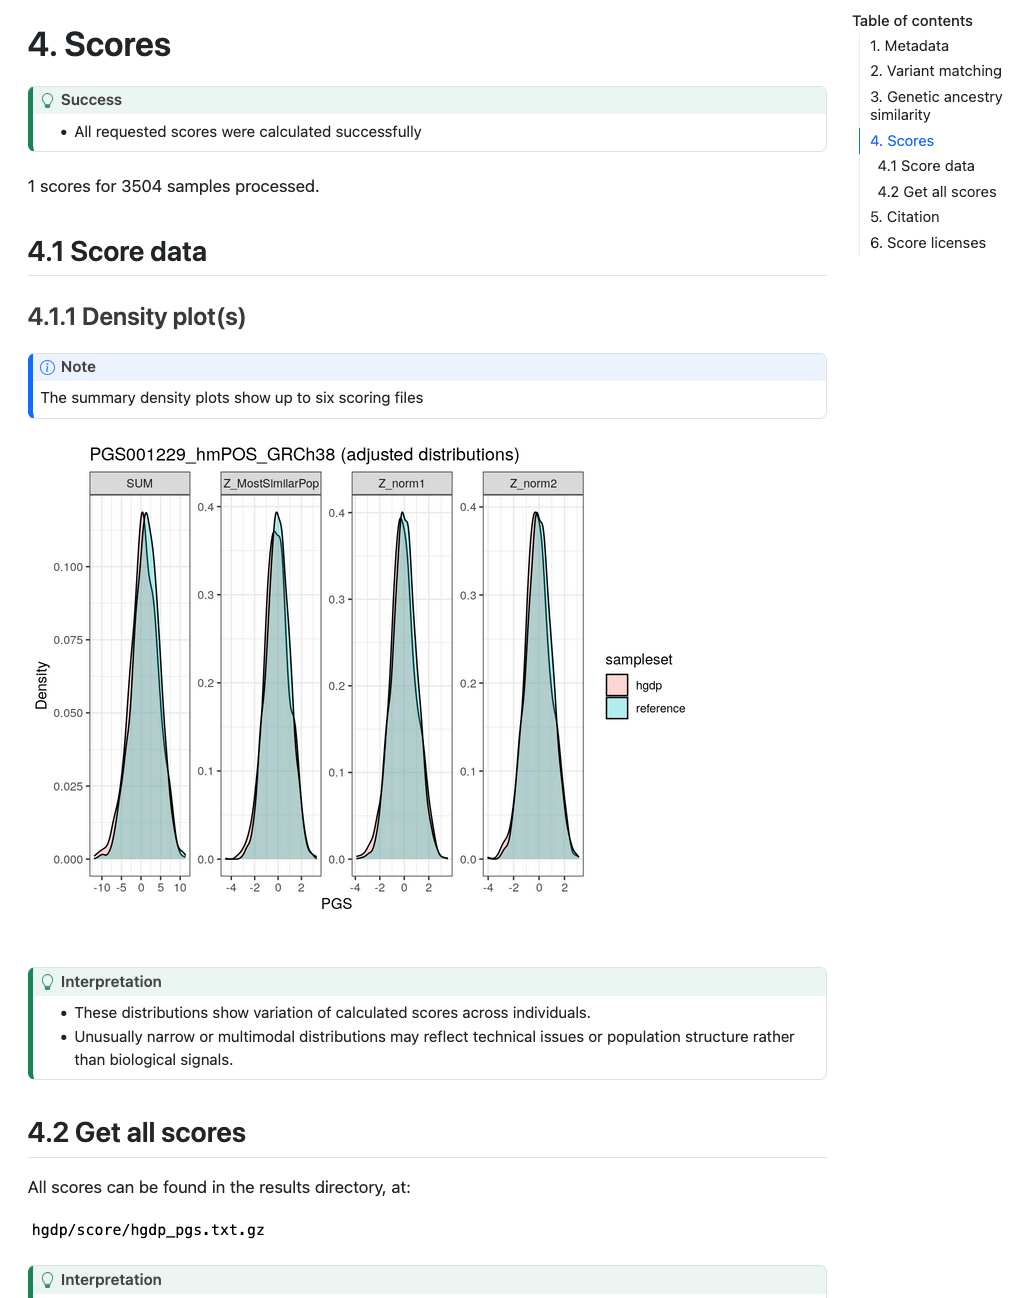
Plots are only created in the report if 50 or more samples are present in the target genomes.
scores.txt.gz
Calculated scores are stored in a gzipped, space-delimited text file called scores.txt.gz.
The data is presented in long format where each PGS for an individual appears on a separate row (length = n_samples * n_pgs).
The file contains the following columns:
sampleset: the name of the input samplesetaccession: the accession ID of the PGS being reportedsample_id: the sample identifiern_matched: the number of variants which were matched to a row in the scoring file (effect allele)allele_count: number of non-missing genotypes used to calculate the PGS for the individual (DENOMin plink)dosage_sum: The sum of all effect allele dosage (where each dosage value is typically 0 / 1 / 2)score: weighted sum of effect_allele dosage × effect_weight across matched variantsscore_avg: normalisation ofscorebyallele_count
Low variant coverage or mismatched genome builds can introduce substantial uncertainty, so users should verify variant matching before interpreting results.
If your samples all come from a homogenous ancestry group higher scores indicate greater genetic liability relative to others in the same dataset. This can be standardised (Z-score) to report relative genetic predisposition. If your samples are multi-ancestry then ancestry-adjusted scores should be calculated (--run_ancestry) to calculate relative genetic predisposition that is less confounded by ancestry.
SUM and AVG are rounded to 6 decimal places but computed using full-precision effect weights.
Users should take note of whether the input samples were used in the development of the PGS being scored as this can lead to inflated estimate of PGS performance (see Wray et al. (2013)).
Variant matching logs
summary.csv
| Report Field | column_name | Description |
|---|---|---|
| Sampleset | dataset | Name of the sampleset / genotyping data. |
| Scoring file | accession | Name of the scoring file. |
| Match summary | match_summary | Indicates whether variants are matched (included in the final scoring file), excluded (matched but removed by filters), or unmatched. |
| Ambiguous | is_ambiguous | True/False flag indicating whether the matched variants are strand-ambiguous (e.g. A/T or C/G). |
| Multiallelic | is_multiallelic | True/False flag indicating whether matched variants are multi-allelic (multiple ALT alleles). |
| Matches strand flip | match_flipped | True/False flag indicating whether the scoring-file variant was originally reported on the opposite strand and required flipping. |
| n | count | Number of variants with this combination of metadata (grouped by [match_status, ambiguous, is_multiallelic, duplicate_best_match, duplicate_ID, match_flipped, match_IDs]). |
| Proportion | fraction | Proportion of the scoring file’s variants that meet the metadata combination in count. |
| Match rate | match_rate | Proportion of the scoring file's variants that passed matching. |
| Passed matching | is_match_rate_ok | True/False flag indicating whether the scoring file passes the --min_overlap threshold and is included in the final scoring set. |
variant_match_logs.zip
This archive contains CSV files that contains all possible matches for each variant in the combined input scoring files. This information is useful to debug a score that is causing problems. Columns contain information about how each variant was matched against the target genomes:
| Field name | Description | |
|---|---|---|
| sampleset | Label of your target genomes | |
| accession | Name of the scoring file. | |
| row_nr | Line number of the variant with reference to the original scoring file (accession). | |
| chr_name | Chromosome name/number associated with the variant. | |
| chr_position | Chromosomal position associated with the variant. | |
| effect_allele | The allele that's dosage is counted (e.g. 2) and multiplied by the variant's weight (effect_weight) when calculating score. The effect allele is also known as the 'risk allele'. | |
| matched_effect_allele | Which of the REF/ALT alleles is the effect_allele in the target dataset. | |
| other_allele | The other non-effect allele(s) at the loci. | |
| target_ref | The reference allele in the target genome at the loci. | |
| target_alts | The alternate allele(s) in the target genome at the loci. | |
| is_matched | boolean: was a match found? | |
| match_type | Record of how the scoring file variant effect_allele & other_allele match the REF/ALT orientation of the ID (e.g. refalt or altref), and whether the variant had to be strand-flipped to achieve a match (match_types ending with _flip). If the non-effect allele (other_allele) is missing from the scoring file variant the match_type will be either (no_oa_refalt or no_oa_altref) and include information about whether it was flipped. | |
| match_summary | Indicates whether the variant is matched (included in the final scoring file), excluded (matched but removed based on variant filters), or unmatched. | |
| is_ambiguous | True/False flag indicating whether the matched variant is strand-ambiguous (e.g. A/T and C/G variants). | |
| is_multiallelic | True/False flag indicating whether the matched variant is multi-allelic (multiple ALT alleles). | |
| target_row_nr | Which row number in the zarr array does this variant correspond to? | |
| filename | The name of the original target genome |
Variant matching is one of the main sources of heterogeneity in PGS calculation.
A high proportion of unmatched or flipped variants may point to genome build mismatches, strand orientation errors, or incomplete imputation.
Carefully review matching statistics, any score that fails the --min_overlap threshold may be unreliable and should be interpreted cautiously.
pipeline_info/
Summary reports generated by nextflow describing the execution of the pipeline in a lot of technical detail (see nextflow tracing & visualisation docs for more detail). The execution report can be useful to see how long a job takes to execute, and how much memory/cpu has been allocated (or overallocated) to specific jobs. The DAG is a visualization of the pipeline that may be useful to understand how the pipeline processes data and the ordering of the modules.
These pipeline reports record the computational provenance of your analysis, the software versions, resources, and execution graph used.
They are mainly for reproducibility and troubleshooting, rather than biological interpretation of scores