pgsc_calc Outputs & report#
The pipeline outputs are written to a results directory (--outdir default is
./results/) with the following structure:
results
├── [sampleset] (directory with results for your data)
│   ├── match (scoring files and variant match metadata)
│   └── score (calculated PGS with summary report)
└── pipeline_info (nextflow pipeline execution data)
score/#
Calculated scores are stored in a gzipped-text space-delimted text file called
[sampleset]_pgs.txt.gz. The data is presented in long form where each PGS for an individual is presented on a
seperate row (length = n_samples*n_pgs), and there will be at least four columns with the following headers:
sampleset: the name of the input sampleset, orreferencefor the panel.FID: the family identifier of each sample within the dataset (may be the same as IID).IID: the identifier of each sample within the dataset.PGS: the accession ID of the PGS being reported.SUM: reports the weighted sum of effect_allele dosages multiplied by their effect_weight for each matched variant in the scoring file for the PGS.
If you have run the pipeline without using ancestry information the following columns may be present:
DENOM: the number of non-missing genotypes used to calculate the PGS for this individual.AVG: normalizesSUMby theDENOMfield (displayed when you calculate the PGS on a small sample size n<50 to avoid using unreliable allele frequency estimates for missing genotypes in the target sample.
Note
The PGS SUM & AVG are rounded to a precision of 6 decimal places in the ouput of the PLINK2_SCORE
commands; however, the calculation of the PGS is based on the full precision of the effect_weight value in the
scoring file.
Warning
Users should take note of whether the input samples were used in the development of the PGS being scored as this can lead to inflated estimate of PGS performance (see Wray et al. (2013) for discussion).
--run_ancestry-specific outputs#
If you have run the pipeline using ancestry information (--run_ancestry) the following columns may be present
in the [sampleset]_pgs.txt.gz file depending on the ancestry adjustments that were run (see Reporting and adjusting PGS in the context of genetic ancestry for
more details):
percentile_MostSimilarPop: PGS reported as a percentile of the distribution for the Most Similar PopulationZ_MostSimilarPop: PGS reported as a Z-score in reference to the mean/sd of the Most Similar PopulationZ_norm1: PGS adjusted to have mean 0 across ancestry groups (result of regressing PGS ~ PCs)Z_norm2: PGS adjusted to have mean 0 and unit variance across ancestry groups (result of regressing resid(PGS)^2 ~ PCs)
A second gzipped-text space-delimited text file called [sampleset]_popsimilarity.txt.gz will also be output,
describing the analysis of the target samples in relation to the reference panel and ancestry labels. The file has the
following headers:
sampleset: the name of the input sampleset, orreferencefor the panel.FID: the family identifier of each sample within the dataset (may be the same as IID).IID: the identifier of each sample within the dataset.[PC1 ... PCN]: The projection of the sample within the PCA space defined by the reference panel. There will be as many PC columns as there are PCs calculated (default: 10).Unrelated: True/False flag for whether the reference panel sample is part of the unrelated subset of individuals used for calculating PGS adjustments.RF_P_[POP LABEL]orMahalanobis_P_[POP LABEL]: Probability that this sample’s PCA projection is consistent with the PCA location of the specified population label defined using either a RandomForest classifier (RF, default) or the Chi-square derived probability from a Mahalanobis distance (Mahalanobis).MostSimilarPop: Population label with the highest probability acrossRF_P_[POP LABEL]orMahalanobis_P_[POP LABEL]columns.MostSimilarPop_LowConfidence: Whether the probability is below the default QC threshold for the population comparison method.REFERENCE: True/False flag for whether the sample is from the reference panel.SuperPop: Population label from the reference panel used to assign theMostSimilarPoplabels and PGS distributions for empirical adjustments.
Report#
A summary report is also provided for your samples (report.html). The report should open in a web browser and
contains useful information about the PGS that were applied, how well the variants in your target dataset match with the
reference panel and scoring files, a summary of the computed genetic ancestry data, and some simple graphs displaying
the distribution of scores in your dataset(s) as a density plot. Some of the sections are only displayed with
--run_ancestry, but we show them all here for reference.
Example reports of the the test profile and ancestry analysis are available to view.
The first section of the report reproduces the nextflow command, and scoring file metadata (imported from the PGS Catalog for each PGS ID) describing the scoring files that were applied to your sampleset(s):
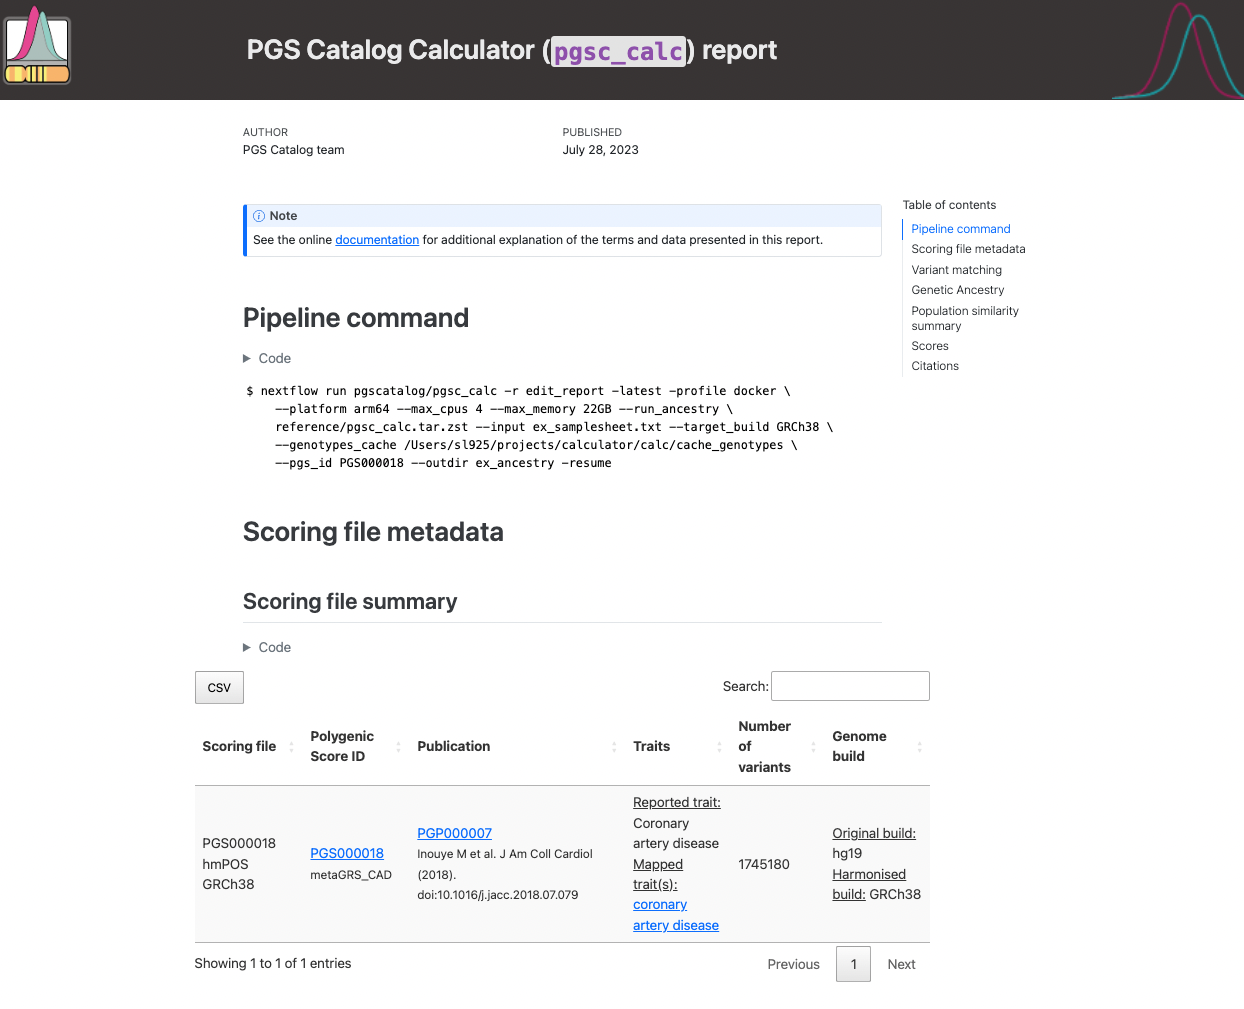
Figure 1. Example of pgsc_calc header.#
The next section reports how the variants in the target sampleset match the other data. The first table describes the
number of variants in the target dataset that overlap with the reference panel (only present with --run_ancestry).
The second table provides a summary of the number and percentage of variants within each score that have been matched,
and whether that score passed the --min_overlap threshold (Passed Matching column) for calculation. The third
table provides a more detailed summary of variant matches broken down by types of variants (e.g., strand ambiguous,
multiallelic, duplicates) for the matched, excluded, and unmatched variants (see match/ section for details):
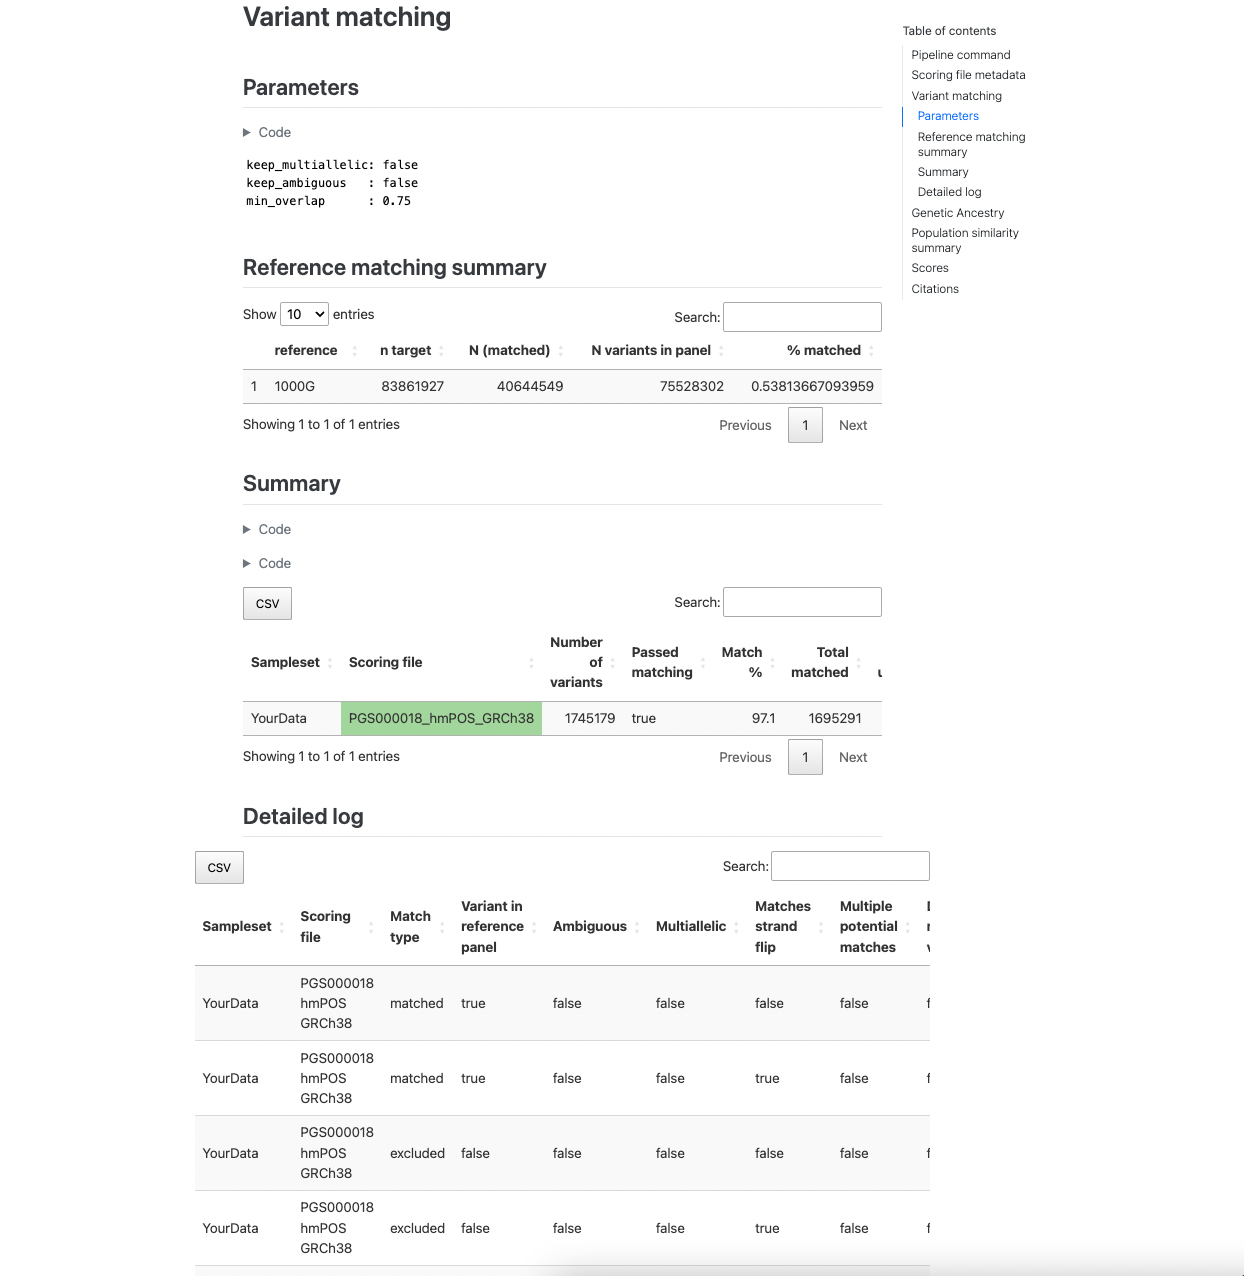
Figure 2. Example of variant matching summaries in the pgsc_calc report.#
The next section describes the results of the genetic ancestry analysis of the target genotypes with the reference
panel data. It first displays a snippet of the [sampleset]_popsimilarity.txt.gz file for reference. A visual display
of the projection of the target data into the reference panel PCA space is plot for the first 6 PCs, where the target
samples are coloured according to the population that they are most similar to in the reference panel. A table
describing the distribution of ancestries within the reference panel and proportions of the target samples who are most
similar to those populations is also provided.
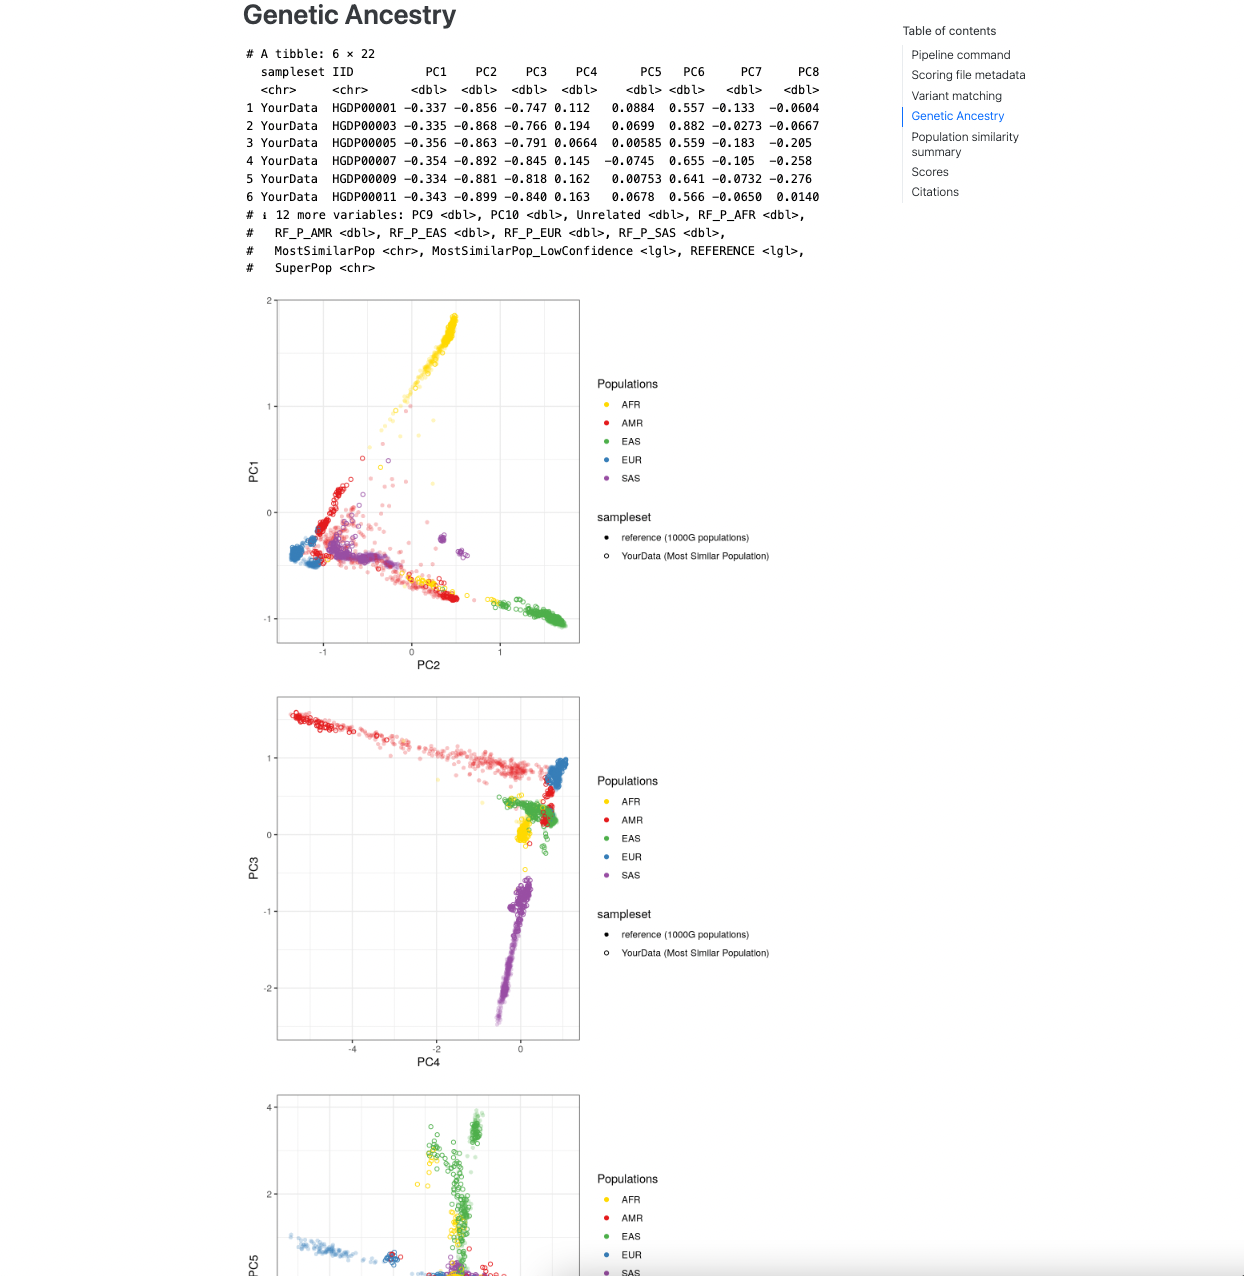
Figure 3. Visualization of genetic ancestry analysis within the report.#
Note
It is important to visually inspect the PCA to make sure that it looks correct (placing the reference populations correctly), and that the projection of individuals from the target dataset looks sensible.
The final section describes the number of scores that were calculated successfully. A visual display of the PGS distribution for a set of example score(s) (up to 6) is provided in the Density plot panel which can be helpful for looking at the distributions of the scores in the target and reference dataset and how it changes for difference PGS adjustment methods:
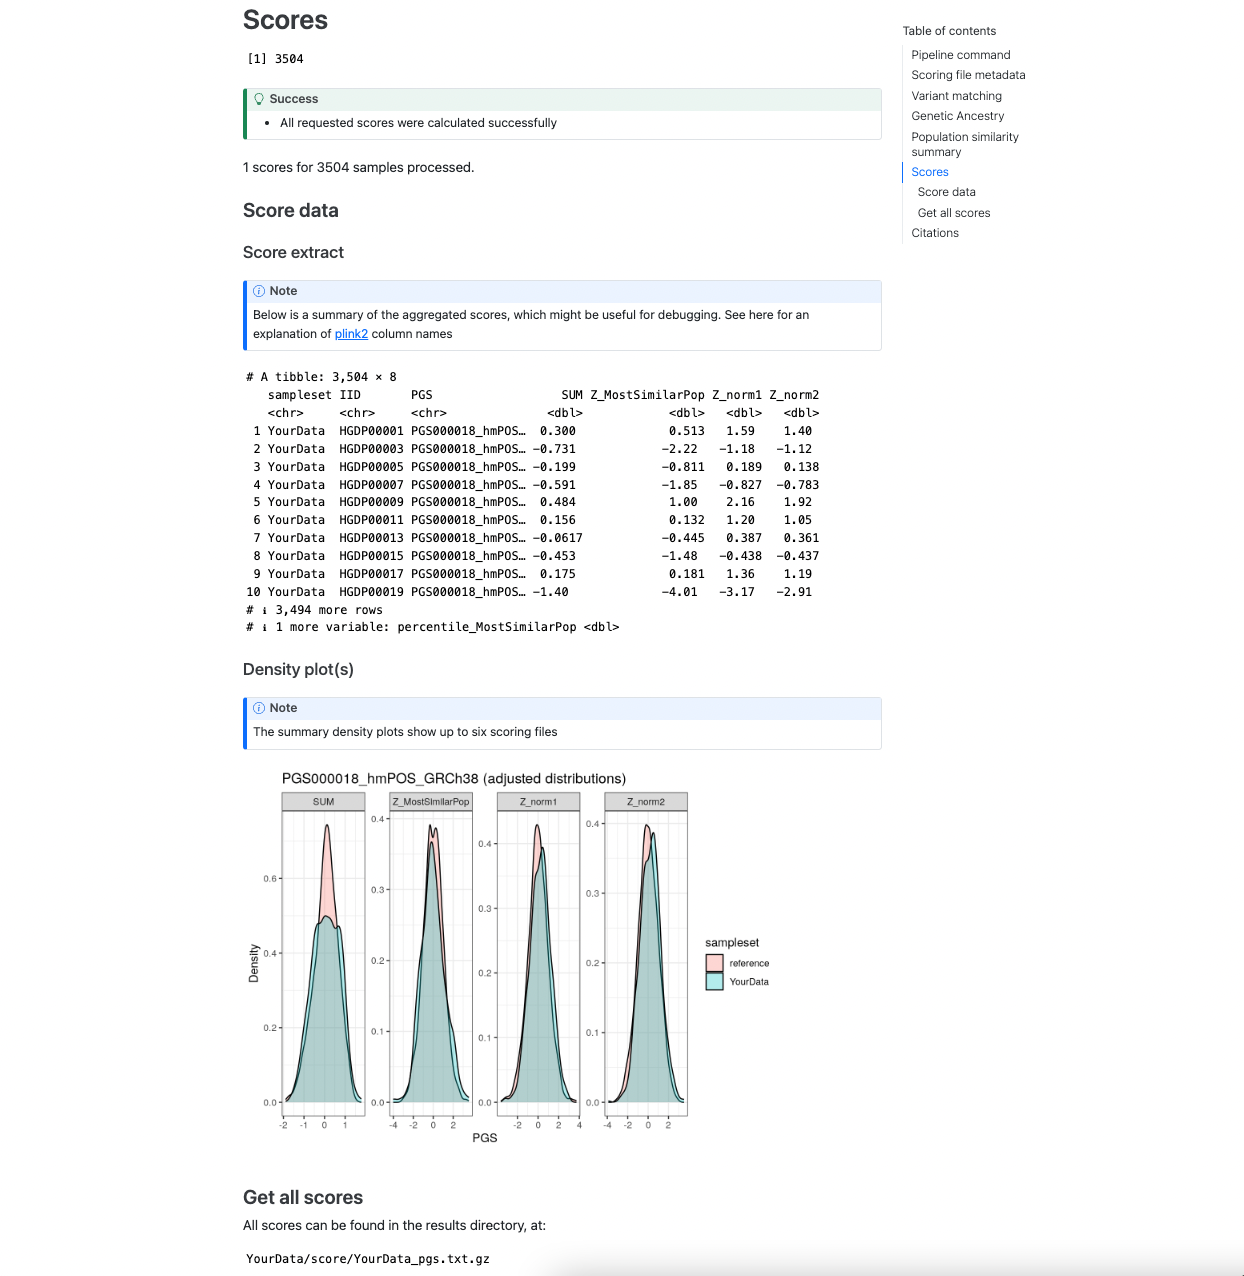
Figure 4. Example scores section including plots of PGS distributions.#
Plots are only created in the report if 50 or more samples are present in the target genomes.
match/#
This directory contains information about the matching of scoring file variants to your genotyping data (sampleset). First a summary file (also displayed in the report) details whether each scoring file passes the minimum variant matching threshold, and the types of variants that were included in the score:
Report Field |
|
Description |
|---|---|---|
Sampleset |
|
Name of the sampleset/genotyping data |
Scoring file |
|
Name of the scoring file. |
Passed matching |
|
True/False flag to indicate whether the scoring file passes the |
Match type |
|
Indicates whether the variants are matched (included in the final scoring file), excluded (matched but removed based on variant filters), or unmatched. |
Ambiguous |
|
True/False flag indicating whether the matched variants are strand-ambiguous (e.g. A/T and C/G variants). |
Multiallelic |
|
True/False flag indicating whether the matched variants are multi-allelic (multiple ALT alleles). |
Multiple potential matches |
|
True/False flag indicating whether a single scoring file variant has multiple potential matches to the target genome. This usually occurs when the variant has no other/non-effect allele, and with variants that have different REF alleles. |
Duplicated matched variants |
|
True/False flag indicating whether multiple scoring file variants match a single target ID. This usually occurs when scoring files have been lifted across builds and two variants now point to the same position (e.g. rsID mergers). |
Matches strand flip |
|
True/False flag indicating whether the scoring file variant is originally reported on the opposite strand (and thus flipped to match) |
Variant in reference panel |
|
True/False flag indicating whether the variant from the scoring file that is matched in the target samples is also present in the variants that overlap with the reference population panel (required for PGS adjustment). |
n |
|
Number of variants with this combination of metadata (grouped by: |
% |
|
Percent of the scoring file’s variants that have the combination of metadata in count. |
The log file is a CSV that contains all possible matches for each variant in the combined input scoring files. This information is useful to debug a score that is causing problems. Columns contain information about how each variant was matched against the target genomes:
|
Description |
|---|---|
|
Line number of the variant with reference to the original scoring file (accession). |
|
Name of the scoring file. |
|
Chromosome name/number associated with the variant. |
|
Chromosomal position associated with the variant. |
|
The allele that’s dosage is counted (e.g. {0, 1, 2}) and multiplied by the variant’s weight (effect_weight) when calculating score. The effect allele is also known as the ‘risk allele’. |
|
The other non-effect allele(s) at the loci. |
|
Value of the effect that is multiplied by the dosage of the effect allele (effect_allele) when calculating the score. Additional information on how the effect_weight was derived is in the weight_type field of the header, and score development method in the metadata downloads. |
|
Whether the dosage is calculated as additive ({0, 1, 2}), dominant ({0, 1}) or recessive ({0, 1}). |
|
Identifier of the matched variant. |
|
Matched variant: reference allele. |
|
Matched variant: alternative allele. |
|
Which of the REF/ALT alleles is the effect_allele in the target dataset. |
|
Record of how the scoring file variant |
|
True/False flag indicating whether the matched variant is multi-allelic (multiple ALT alleles). |
|
True/False flag indicating whether the matched variant is strand-ambiguous (e.g. A/T and C/G variants). |
|
True/False flag indicating whether the matched variant is on the opposite strand (flipped). |
|
True/False flag indicating whether this the best |
|
True/False flag indicating whether this matched variant is excluded from the final scoring file. |
|
True/False flag indicating whether a single scoring file variants has multiple potential matches to the target genome. This usually occurs when the variant has no other_allele, and with variants that have different REF alleles. |
|
True/False flag indicating whether multiple scoring file variants match a single target ID. |
|
True/False flag indicating whether the matched variant is also found in the reference panel genotypes. |
|
Indicates whether the variant is matched (included in the final scoring file), excluded (matched but removed based on variant filters), not_best (a different match candidate was selected for this scoring file variant), or unmatched. |
|
Name of the sampleset/genotyping data. |
Processed scoring files are also present in this directory. Briefly, variants in the scoring files are matched against
the target genomes. Common variants across different scores are combined (left joined, so each score is an additional
column). The combined scores are then partially split to overcome PLINK2 technical limitations (e.g. calculating
different effect types such as dominant/recessive). Once scores are calculated from these partially split scoring
files, scores are aggregated to produce the final results in score/.
pipeline_info/#
Summary reports generated by nextflow describing the execution of the pipeline in a lot of technical detail (see nextflow tracing & visulisation docs for more detail). The execution report can be useful to see how long a job takes to execute, and how much memory/cpu has been allocated (or overallocated) to specific jobs. The DAG is a visualization of the pipline that may be useful to understand how the pipeline processes data and the ordering of the modules.